Understanding local real estate trends

Why do real estate trends matter?
There’s a lot of real estate data out there to analyze, like how quickly home prices are rising or how long homes in your area are taking to sell. All this information can quickly feel overwhelming if you don’t have a grasp on what the data means and why it matters.
We created this resource to help anyone who isn’t an expert or a data nerd understand today’s real estate trends. If you know what’s happening in your local area, you can make better decisions about when to sell, for how much and when and where to buy.
We’ve published information for the cities where Opendoor currently buys and sells homes. We’ve also included a glossary on common real estate terms referenced in the report. Here are the metros we cover:
Atlanta, GA | Austin, TX | Charlotte, NC | Dallas-Fort Worth, TX | Denver, CO | Houston, TX | Jacksonville, FL | Las Vegas, NV | Los Angeles, CA | Minneapolis-St. Paul, MN | Nashville, TN | Orlando, FL | Phoenix, AZ | Portland, OR | Raleigh-Durham, NC | Riverside, CA | Sacramento, CA | San Antonio, TX | Tampa, FL | Tucson, AZ
Don’t see your city? Sign up for updates.
When is the best time to buy or sell?
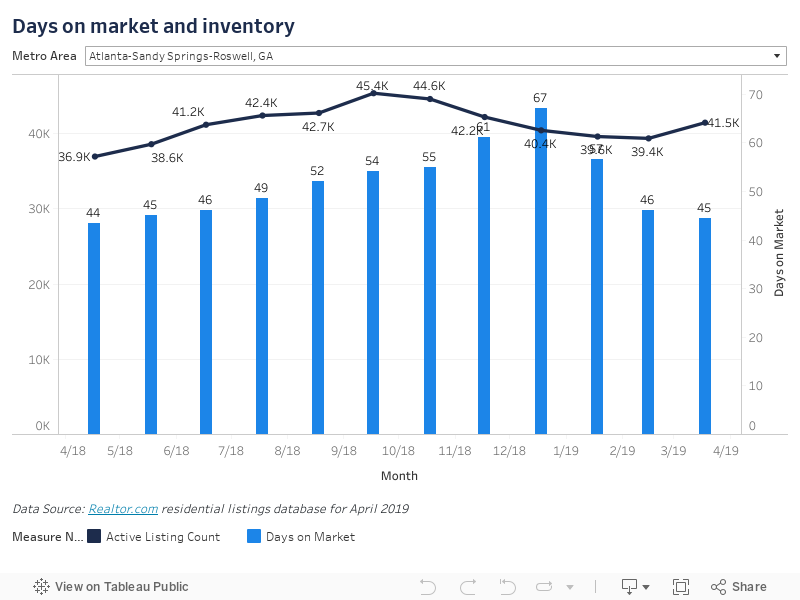
By understanding active listings and days on market across each month of the year, you will have a better gauge on how real estate market conditions in your area change across the seasons. This will help you determine whether you are trying to buy or sell in a relatively busy or quiet time of year, so you can manage your expectations accordingly.
Similar to how weather patterns change across winter, spring, summer and fall, real estate activity fluctuates too. This means that certain months during the year tend to be busier for buying and selling and others tend to be slower.
According to the National Association of Realtors, home sales generally increase significantly in spring and the busiest months tend to be May, June, July and August. The slowest months tend to be November, December, January and February.
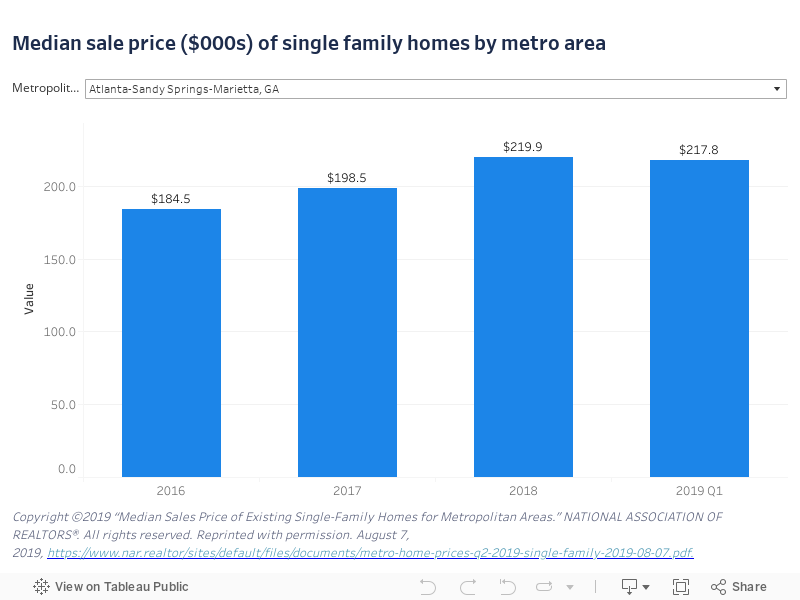
What are median home prices in my area?
One of the most critical factors for home buyers and sellers is understanding how home prices are changing over time. If you’re looking to buy, understanding the price points of homes in your area is essential in determining how much house you can afford and what your monthly payments will look like. If you’re looking to sell, you can track how much your home value may have appreciated (increased in value) and how much money you could make from a sale (minus fees and preparation costs).
→ Use our home sale calculator to estimate how much you could make selling your house.
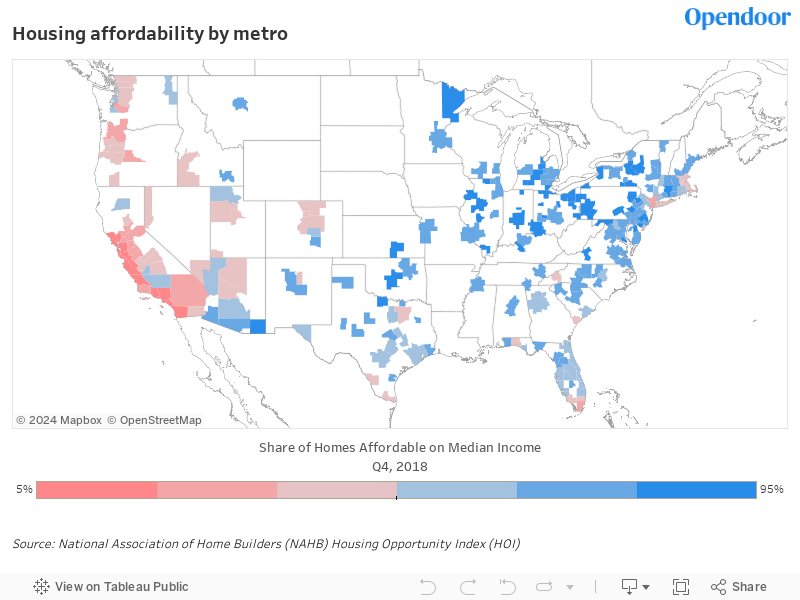
Can I afford to buy a house in my area?
The map below shows the percentage of people in each area who can afford the median home price with the median family income. The higher the percentage (in blue), the more affordable the metro area.
To understand what your monthly payments could look like, check out our mortgage calculator. You can see from the example below what the monthly payments would look like for a $200,000 home at two different mortgage interest rates. In 2019, 30-year fixed mortgage rates have fluctuated between 3.5% and 4.5%.
A 1% increase in the mortgage rate means you’d pay almost 10% more per month.
| Purchase price | $200,000 |
| Monthly payment (3.5% interest rate) | $986 |
| Monthly payment (4.5% interest rate) | $1,076 |
| $ increase | $90 |
| % increase | 9.1% |
Source: Opendoor mortgage calculator, as of August 2019; Assumes 20% down; $75/month for insurance; and $210/month for property tax.
Further reading: How to determine how much home you can afford
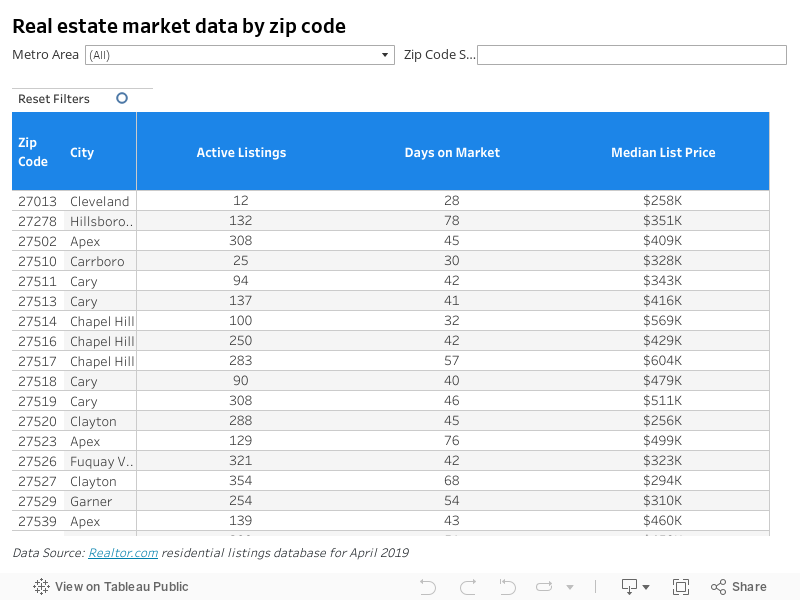
What are housing market trends in my zip code?
So far, our data has focused on metro area information. But we know that the most important trends are happening in your local neighborhood. The table below provides zip code level information about active listings, days on market, and median list price.
When you are exploring the table, consider looking at:
So far, our data has focused on metro area information. But we know that the most important trends are happening in your local neighborhood. The table below provides zip code level information about active listings, days on market, and median list price.
| Look at… | To understand… |
| Active listings | Get a sense for how much competition there is in a particular zip code.
– As a seller: See how many others are also selling |
| Days on market | – If days on market is relatively low, this signals a market that favors sellers
– If days on market is relatively high, this signals a market that favors buyers |
| Median list price | Price movement in a zip code tells you how desirable and competitive an area is.
Note this is “list price” (not sale price), so there could be factors where homes with a particular list price may eventually sell above or below. |
| How nearby zip codes compare | – If you are flexible in your house search, you can compare nearby zip codes
– One zip code may end up being more favorable to your situation |
Further reading: Housing market trends 2019
Key takeaways
For anyone that’s bought or sold a home, you’ve probably been overwhelmed by all of the information and numbers you need to decipher. We know that local real estate trends can be confusing, so we hope that this primer has helped you feel more comfortable with what information you should be looking at and how it can help you be better informed in your house search. Best of luck!
This article is meant for informational purposes only and is not intended to be construed as financial, tax, legal, or insurance advice. Opendoor always encourages you to reach out to an advisor regarding your own situation.
Glossary of terms
- Active listings: The number of homes that are listed for sale at any given time
- Days on market: The number of days a property is listed before a seller signs a contract to sell the property
- Home price appreciation (or depreciation): The amount home prices have increased (or decreased)
- Median home price: Middle value in a set of home prices over a given time period in a given area. Half of home prices are above the median and half are below.
- Median family income: Middle value in a set of incomes by household. Half have income greater than the median and half have income less than the median.
- Median list price: Middle value in a set of listed home prices over a given time period in a given area. Half of listed home prices are above the median and half are below.
- Median sale price: Middle value in a set of home sale prices over a given time period in a given area. Half of home sale prices are above the median and half are below.
- Seasonality: Predictable changes in data trends that occur every year
- Supply and demand: The dynamic created between buyers of a good or service and sellers of a good or service. For real estate, the amount of available houses for sale (supply) and the desire to buy those houses (demand) has an impact on the price of a house.
Unlock an offer on your home
- Get a free, no-obligation offer in 24 hours.
- Skip the hassle of listings, showings, and repairs.
- Close on your own timeline.