Low mortgage rates, tight supply, and softening home prices: what does it all mean if you’re buying a home, selling, or just sitting tight? See our in-depth guide to the 2020 housing market or skim the digest below.
Housing demand bolstered by a growing economy
Increases in employment, wages, and consumer spending throughout 2019 are good news for the housing market as we enter 2020. When more people have jobs and higher wages, they tend to have more money to spend on houses.

While global economic growth has showed signs of slowing down, the Federal Reserve has aimed to support the US economy by keeping interest rates low.
Mortgage rates dropped over 2019, making it cheaper to purchase a home
Lower interest rates make it cheaper to borrow money, making home ownership more affordable and allowing more people to qualify for a mortgage. Mortgage rates have continued to stay historically low between 3.5% – 4.5% this past year, according to Freddie Mac. As of January 2020, they sit at just 3.7%.

Consumers have less debt and more disposable income to buy a home
A good sign of financial health to buy a home is spending less disposable income on repaying debts like credit cards, auto loans, and personal loans.
Today, household budgets continue to be the strongest they’ve been in over 40 years and a far cry from 2008.

While the chart above paints a rosy picture of consumer finances, it doesn’t include student loan debt which has reached record levels and significantly affects Millennials (those born 1981-1997).
According to Realtor.com, 4.8 million millennials are hitting the peak home buying age this year. For the first time ever, Millennials’ share of mortgage originations is expected to surpass 50 percent, outnumbering Gen X and Babyboomers combined.
Many economists agree 2020 is not 2008
While the positive trends in unemployment and economic growth over the past year can always reverse, many of the symptoms that led to the major housing market crash in 2008 aren’t present today.
Why is 2020 different than 2008?
- We have much tighter lending standards with the number of people unable to pay their mortgage at its lowest rate in over a decade.
- Households have more disposable income and less debt, bolstered by low unemployment.
- Housing supply is significantly lower than pre-crisis conditions where there was “over-building” before prices crashed in 2008.
If a housing market crash is your primary concern for avoiding a home purchase, then it may be better to focus your search on a home you can comfortably afford rather than trying to predict the market and overextend your finances.
Homes are becoming more affordable but still challenging for first-time buyers
We can measure housing affordability on a scale from 0 (most affordable) to 10 (least affordable) using the John Burns Affordability Index.
At the beginning of last year, the US housing market reached a 7/10, meaning it was expensive for the average buyer. But, over 2019, the market returned to its average level of affordability.
This is good news for buyers looking for a better deal and for sellers who want to see more buyers enter the market.

Low supply is making it challenging to find affordable starter homes
Over the past five years, there has been rapid growth in home prices while the number of homes for sale has continued to decline. This has caused prices to rise beyond what many people can afford.

Supply is especially low when it comes to “starter homes” for first-time home buyers. The chart below shows how the running total of new household formations (aka new families that need homes) in blue has outpaced total new homes built in orange. In grey, you can see that a small percentage of new homes have less than 1800 sq ft, representing new “starter homes”.

The good news is the number of new single family homes being built is expected to reach over 1 million in 2020, which would be the fastest rate since 2007.
However, it will take a while for this new inventory to hit the market so expect the bidding wars to continue in competitive neighborhoods.
What do these trends mean for me?
All of the trends we’ve described will take shape differently across the country. Use the chart below to estimate the market “temperature” where you’re selling or thinking of buying.
Hotter markets are characterized by lower supply, fewer days on market, and faster rising home prices. In markets with these conditions, sellers tend to have the upper hand. In cooler markets, the opposite is true, meaning buyers can have more options and negotiate a better deal.
Market Temperature
Regional Multiple Listing Service data through
Select metro
Warm
75/100
DOM
Average days on market
Appreciation
Median sale price
Supply
Months of supply
To calculate market temperature, we apply a series of coefficients that weigh how the market compares to the median Days on Market, median sales price, and average months of supply. The score is between 1 - 100, where <= 25 is "Cold"; <= 50 is "Cool"; <= 75 is "Warm"; <= 100 is "Hot". Hot markets tend to have faster selling homes, rising prices, and low supply. The reverse is true for cold markets.
Don’t see data for your market? Sign up for updates when Opendoor launches near you.
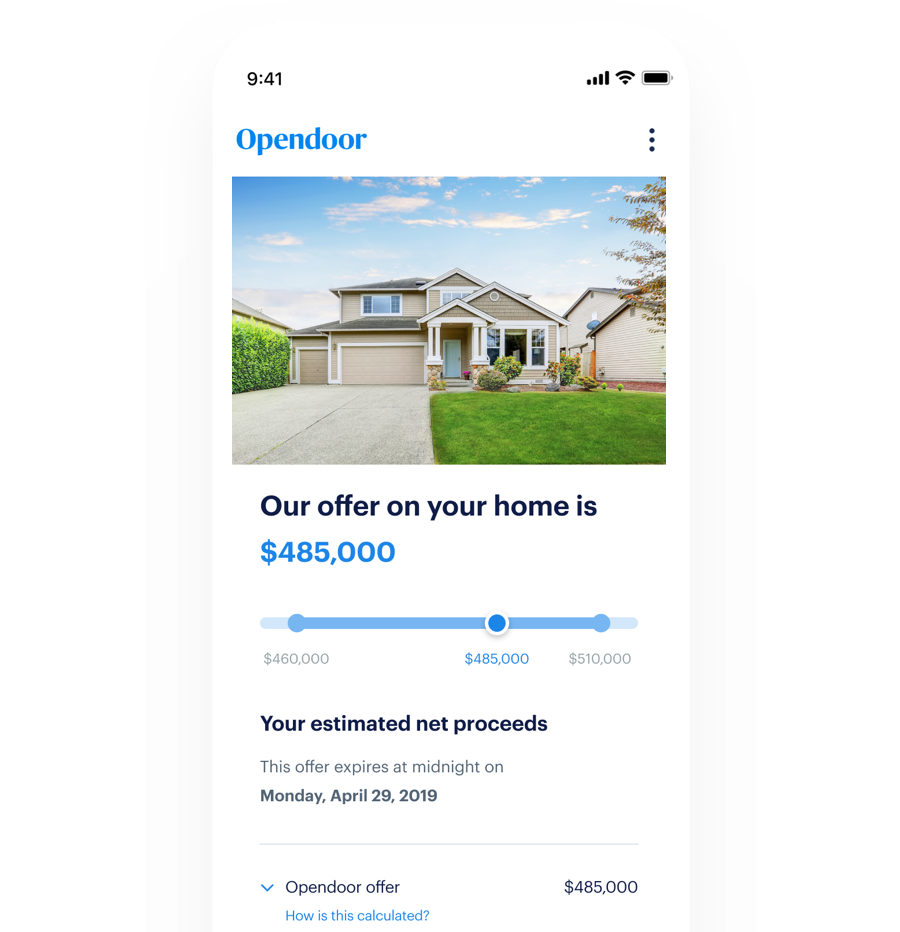
Anxious about the market? Opendoor can help.
Opendoor is a full-service real estate company, and we’ve created a new way to buy, sell, or trade-in a home that emphasizes certainty and convenience.
Learn about how selling to us works or view our listings to find a home you love. If you’ve found “the one”, download our app to unlock homes in your area and make an offer when you’re ready.
And if you’re buying and selling at the same time, learn more about trading-in your home. We’ve made that simple too.